logo

Welcome to our temporary landing page

Making social development more informed and prettier
to look at.

Your all-in-one data & communications partner.
Analytics. Visualization. Dissemination.

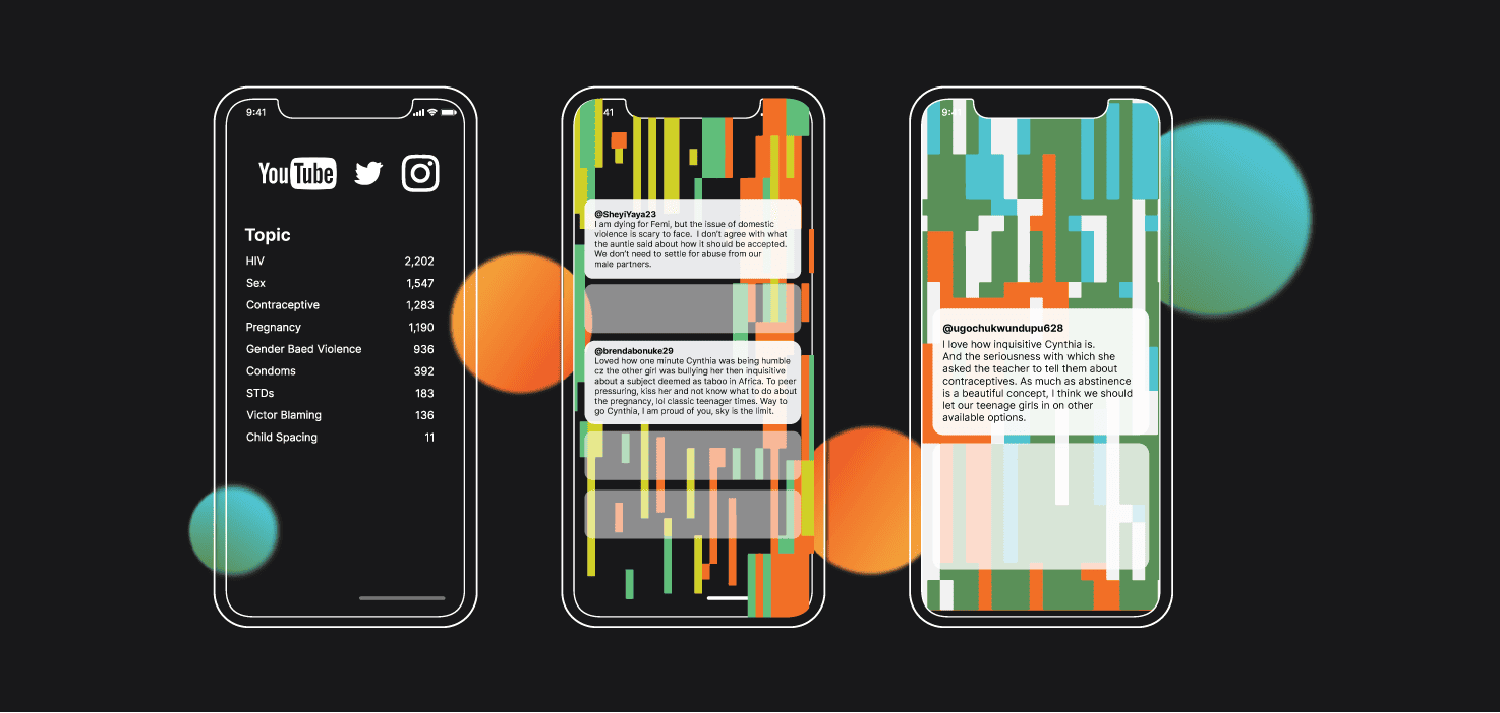
For nearly a decade, we've connected data to the human experience across all social sectors.

We're actively seeking new projects.

We're an interdisciplinary team of data scientists, researchers, developers, and designers.

If you like what you see, we’d love to collaborate.

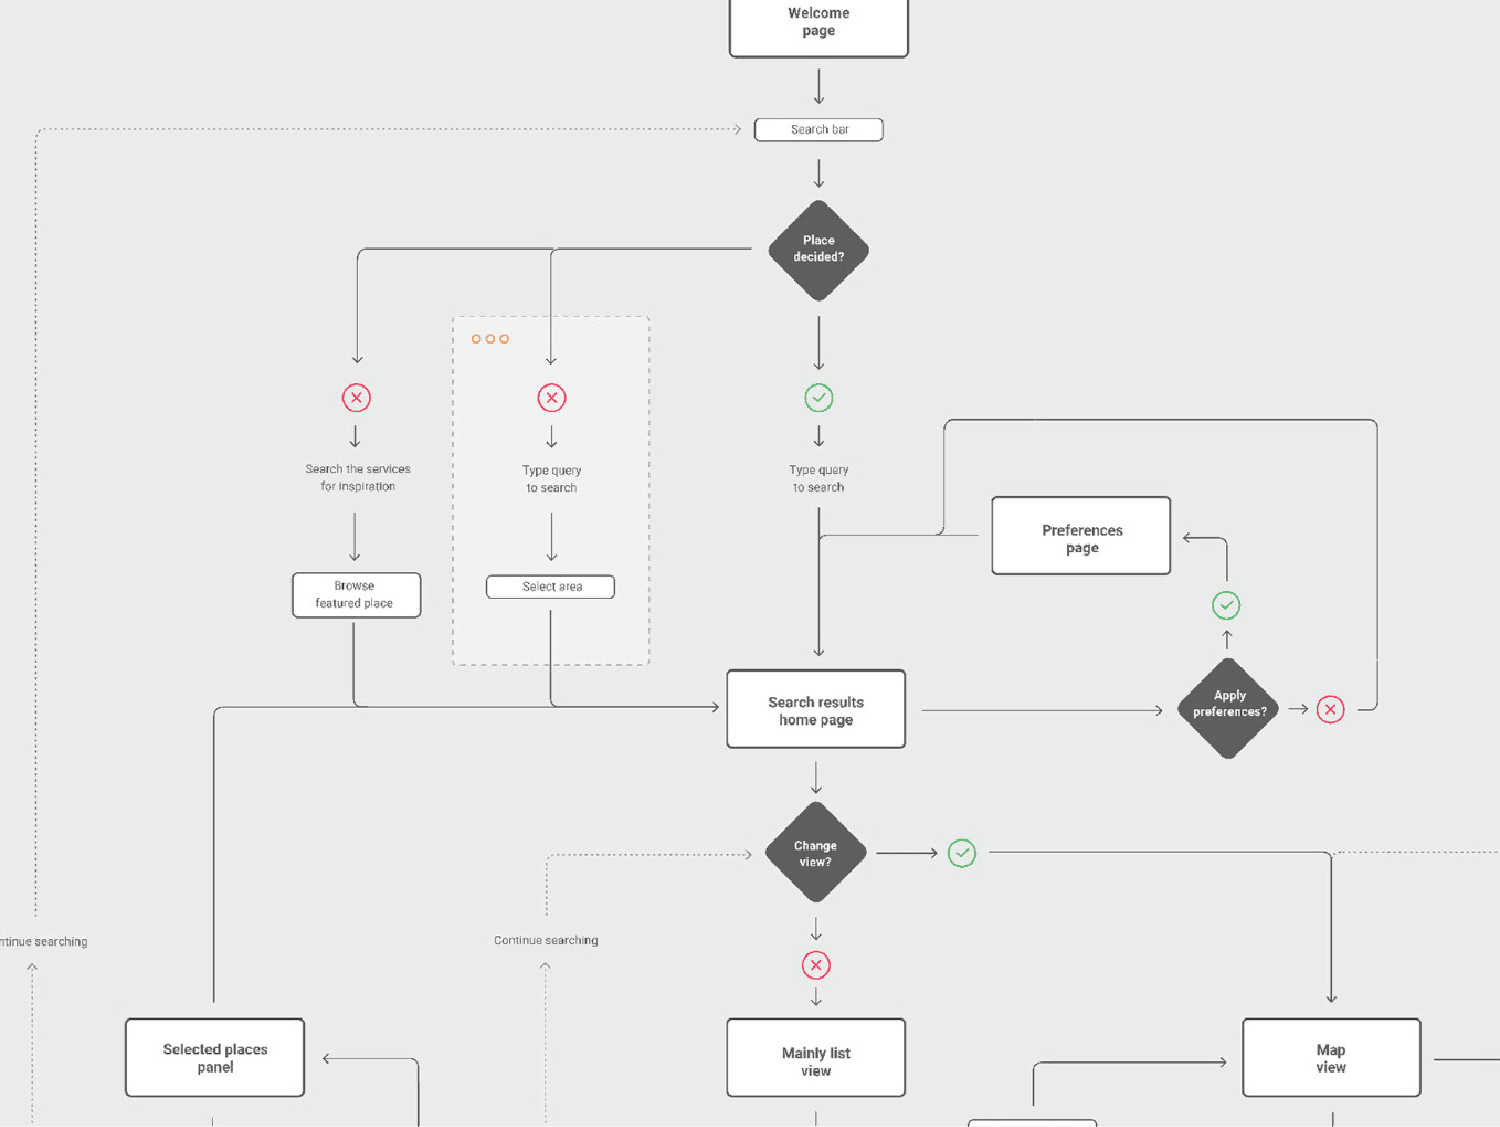
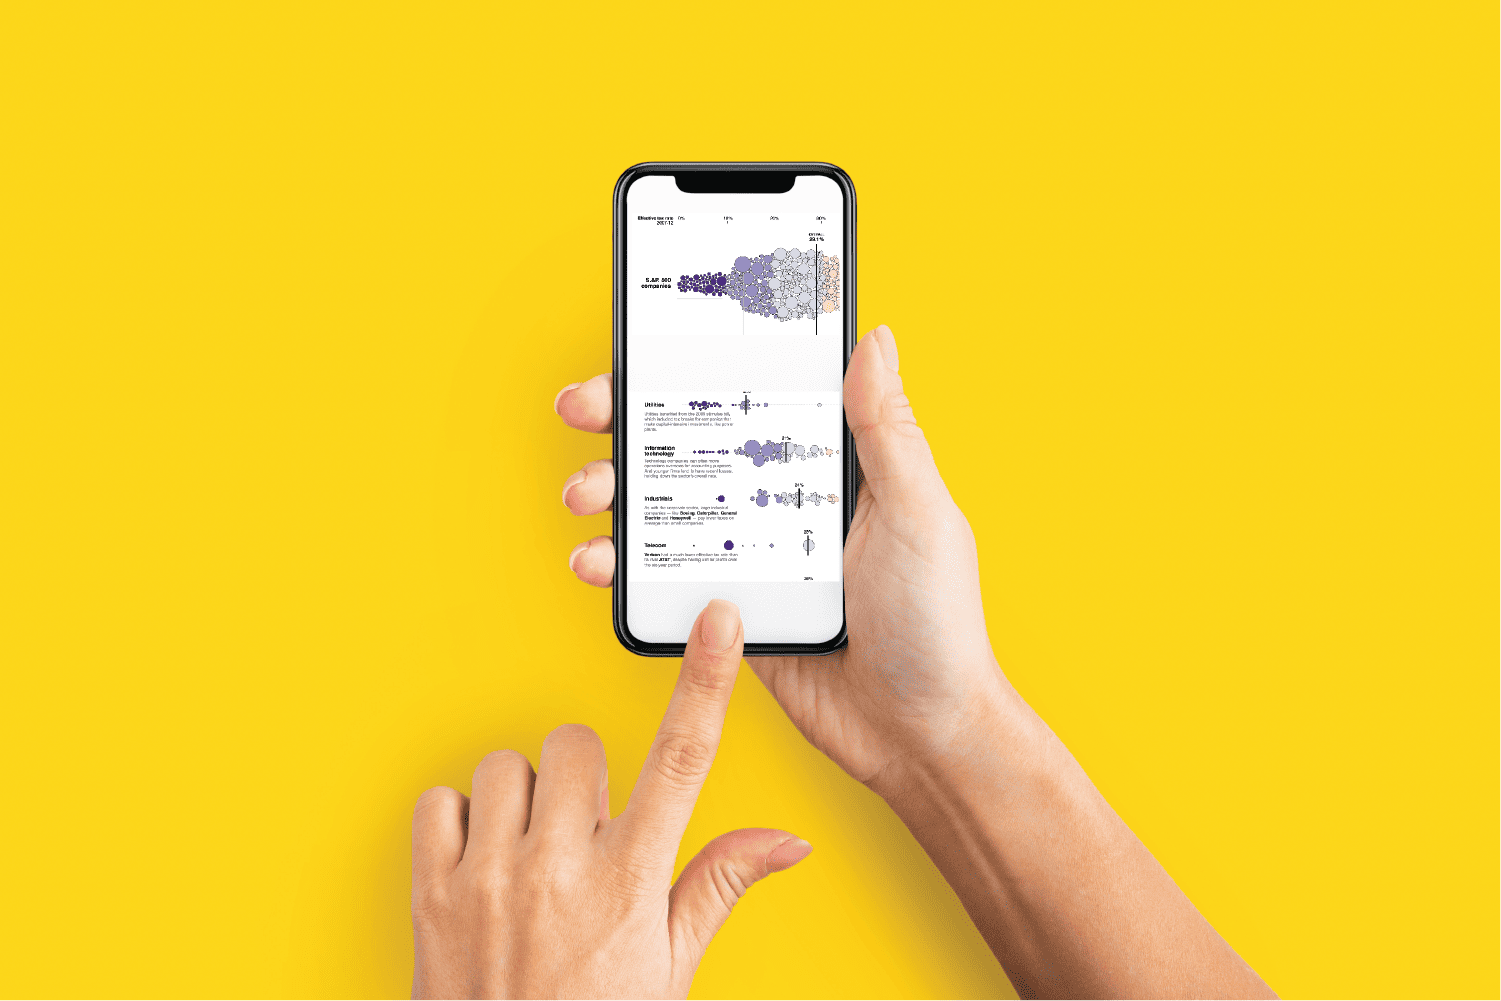
We are low-key obsessed with the art and science of effective data visualization.

We’d love to share experiences, a coffee, or practice AI prompting for analytics.

Firstly, f*ck the Trump administration - how this is being done is disgusting.

Second, we are here if you’re looking for resources in data visualization, storytelling, or AI analytics—or new consulting opportunities.

portfolio image portfolio image portfolio Photoportfolio image portfolio image portfolio image portfolio image portfolio image portfolio image portfolio image portfolio image portfolio image portfolio image
portfolio image portfolio image portfolio image portfolio image imageportfolio image portfolio image portfolio image portfolio image portfolio image Image portfolioportfolio image portfolio image portfolio image portfolio image
portfolio Photoportfolio Photoportfolio Photoportfolio Photoportfolio Photoportfolio Photoportfolio Photoportfolio Photoportfolio Photoportfolio Photoportfolio Photoportfolio PhotoImage portfolio
portfolio PhotoMissing_Resettlement Photoportfolio Photoportfolio Photoportfolio Photoportfolio Photoportfolio Photoportfolio Photoportfolio Photoportfolio Photoportfolio Photoportfolio Photoportfolio Photoportfolio Photo
portfolio Photoportfolio Photoportfolio Photoportfolio Photoportfolio Photoportfolio Photoportfolio Photoportfolio Photoportfolio Photoportfolio Photoportfolio Photoportfolio Photoportfolio Photoportfolio Photo
portfolio Photoportfolio Photoportfolio Photoportfolio Photoportfolio Photoportfolio Photoportfolio Photoportfolio Photoportfolio Photoportfolio Photoportfolio Photo
Data-driven storytelling
Beautiful
Critical thinkers
Multi-disciplinary
AI Innovators

Visualst was born out of deep frustration with the inaccessibility of social development research and data. The founder found herself in an endless loop of data collection and report writing, where valuable insights remained siloed and overlooked.
Figuring out the right questions, solving hard problems, and finding ways to amaze and engage people with data reside at our core. We like to think big and work fast—yet carefully, holistically, cross-functionally, strategically, and with a long-term vision.
In the current climate, we remain steadfast in our mission not just to design visualizations that make data more accessible, but to make it matter.

Project Logos
Climate Resilience (RESINA)

DATA VISUALIZATION PARTNER

Mozambique, 2023-2025

Led the strategic thinking and planning of data capture from various climate adaption and mitigation projects in agriculture and water. Crafted custom visualizations and infographics for routine reporting and logframe tracking.

Project Logos
Supporting the Policy Environment for Economic Development (SPEED)

DATA STORYTELLING PARTNER

Mozambique, 2019-2026

Visualst has been a key partner in the DAI-led SPEED consortium, transforming critical data into strategic analytics and communication materials across biodiversity, energy, economy, and agriculture. Our products translate critical evidence for policy makers, businesses, and other partners use to make investment decisions. 

Project Logos
Databoom, Funded by the Gates Foundation

DATA ANALYST

Global (Kenya, Nigeria, India), 2024-2025

Visualst supported Databoom in mapping evidence for the Gender Norms and Learning Agenda (GNLA) team’s new learning agenda, synthesizing qualitative and quantitative data from investments to distill key insights and tell the story of the GNLA portfolio’s learnings.

Project Logos
Global Alliance for Vaccines and Immunization (Gavi) 

DATA JOURNALIST & MEL EXPERT

Global, 2021-2023

Spearheaded data journalism for Gavi’s communication team, launching the Five Chart Series and COVAX Data Briefer. Led the redesign of data and measurement products to enhance evidence sharing.

Project Logos
World Health Organization, in partnership with Triangulate Health 

ANALYTICAL DECISION TOOL

Global, 2021-2022

Led human-centered design workshops and beta-tested a platform (R Shiny app) hosting open-source datasets and decision-making tools to optimize primary care packages to achieve universal health coverage globally. 

Project Logos
Enveritas

SUSTAINABILITY SCORECARDS 

Global, 2018-2020

Collaborated with country analytics teams to design and automate (JSON) CEO-level scorecards that track the sustainability of the coffee supply chain across farmers and suppliers.

Project Logos
Mott MacDonald

DATA & LEARNING PARTNER

Southern Africa,  2018-2020

Engineered a comprehensive monitoring, evaluation, and learning system for grantee reporting and implementation. Liaised directly with grantees to capture key learnings and communicate insights effectively.

Project Logos
Population Services International

IMPLEMENTATION RESEARCH PARTNER

Mozambique, 2019-2021

Conducted ongoing implementation research to enhance programmatic learning and strengthen the adaptive capacity of the Vale a Pena project as it tested various family planning delivery models for adolescents.

“Visualst has been an invaluable partner as our project has evolved. Always responsive to our research and design needs, Visualst consistently delivers bespoke products that elevate our ability to share what we do and why it is important.”

Ashley Fitzpatrick,
Peace Process Secretariat

“What sets Visualst apart is their craft. Their work is always client centered and they find just the right balance between data visualization and art –their design principles are
unparalleled.”

Kim Longfield
Databoom

“Visualst’s consistently delivers high-quality work. They tackled tight timelines and vague specs, collaborating across our organization to clarify needs and create beautiful products.”

Nick Spigler,
formerly Enveritas, Uber

“Visualst is a visionary one-ofa-kind firm that changed my professional trajectory dramatically and I am so grateful to have had that quality of mentorship.”

Charama Sulemane,
ENGIE

Services

In a world overwhelmed by misinformation and overflowing with data, we need more than beautiful charts and sleek dashboards—we need shared understanding.

A shared understanding that bridges complexity and clarity, information and values, reason and emotion, science and art.

Our challenge—and our purpose—is not just to design visualizations that make data more accessible, but to make it matter. Visualst is a public-interest data design and analytics consultancy. We transform data into stories that matter.
Regardless of where you are in your measurement and analytics journey, we can help:

1. Data & Measurement Setup

With 10+ years of experience in MEL systems, we help set up indicators, measurement frameworks, data capture processes, and secure data warehouses for efficient storage and analysis.

2. Visualization

We use a human-centric design process to create visualizations tailored to their purpose and audience. Our solutions adapt to client needs—whether dashboards, web tools, infographics, PPT decks, or beyond.

3. Storytelling/ Communication

Our visualization techniques contextualize data and information, uncovering new perspectives, insights, and pathways for action.

Expertise:

Tableau/Power BI/Flourish
Adobe Suite
Office 365
DataWrapper
D3/Python
GIS
MaxQDA/Atlas ti/InVivo
Google AI Studio
R/Stata
Data Science Collab Tools (GitHub,SmilingCo, Kaggle)

Sector Experience:

Health Financing
Family Planning
UHC/PHC
Climate Change
Energy
Finance/FinTech
Youth
Gender
Agriculture
Education